


Working With Messy Data Using Pandas in Python
Hi lovely people! 👋 I am working on a project and had to wrangle some messy data using Pandas. New project means new ideas for articles and so here I am with an article about how to work with messy data using Pandas in Python. I will be covering only some of the basics that you will need to know for most of your data analysis projects. So without wasting any time let’s begin!
Dataset
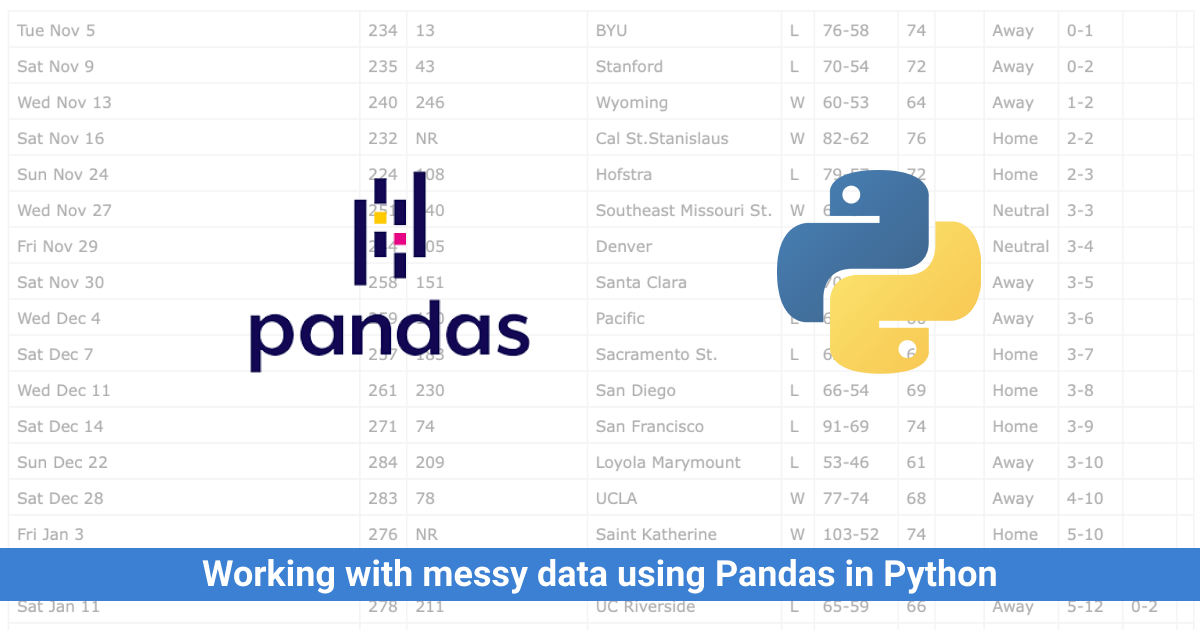
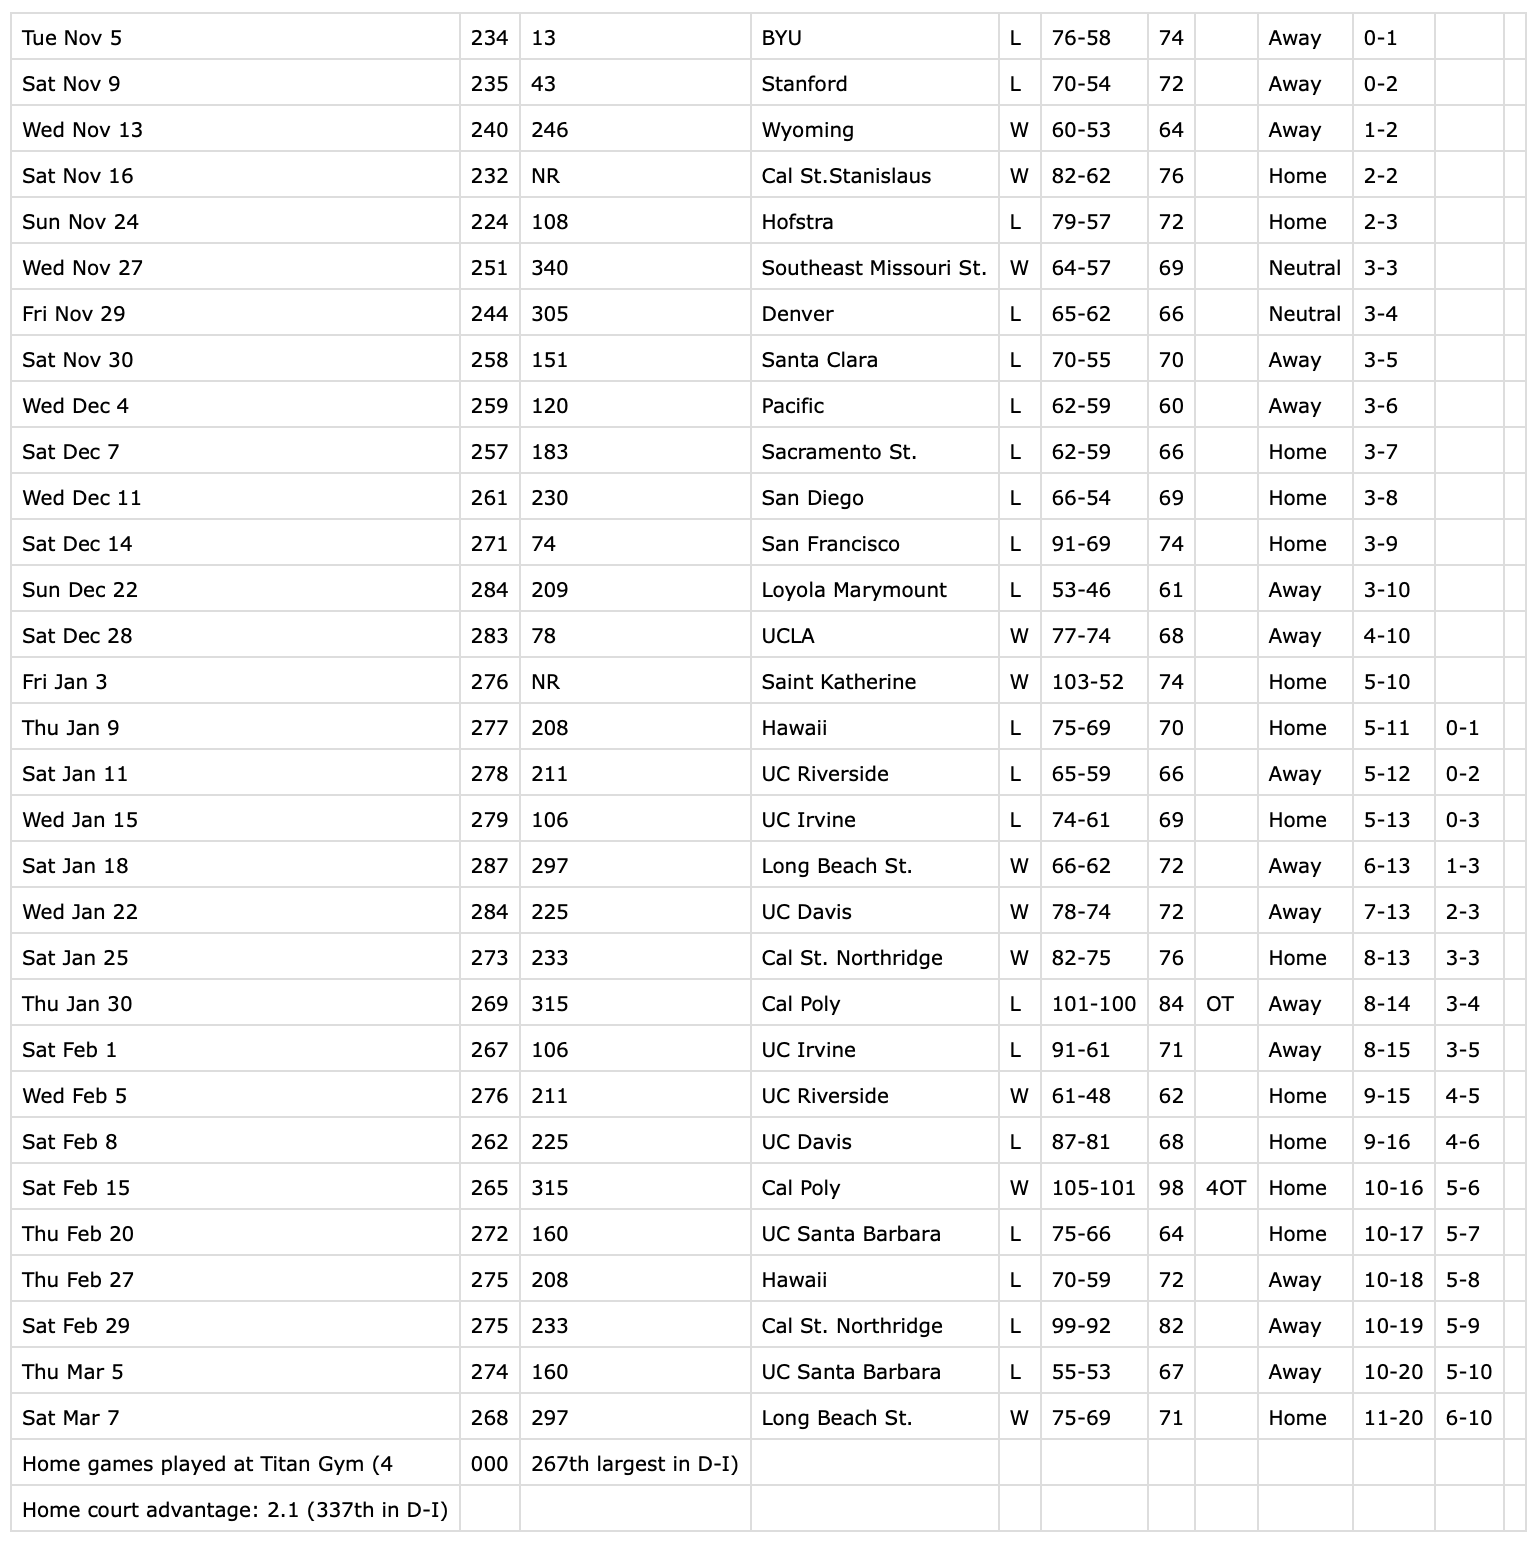
My dataset is a CSV file containing a seasonal game schedule for a particular basketball team. The main goal is to process this data using Pandas, replace certain info, remove certain rows, and sum certain columns. In short, your typical data processing stuff. You can get the input file from here. This is what the file looks like:
Reading the data into a Pandas DataFrame
This data is in a CSV file named input_file.csv. We can make use of the read_csv method of the Pandas library to load it in. Normally you would read a CSV like this:
import pandas as pd
schedule_dataframe = pd.read_csv('input_file.csv')
This is the output when we try printing the DataFrame:
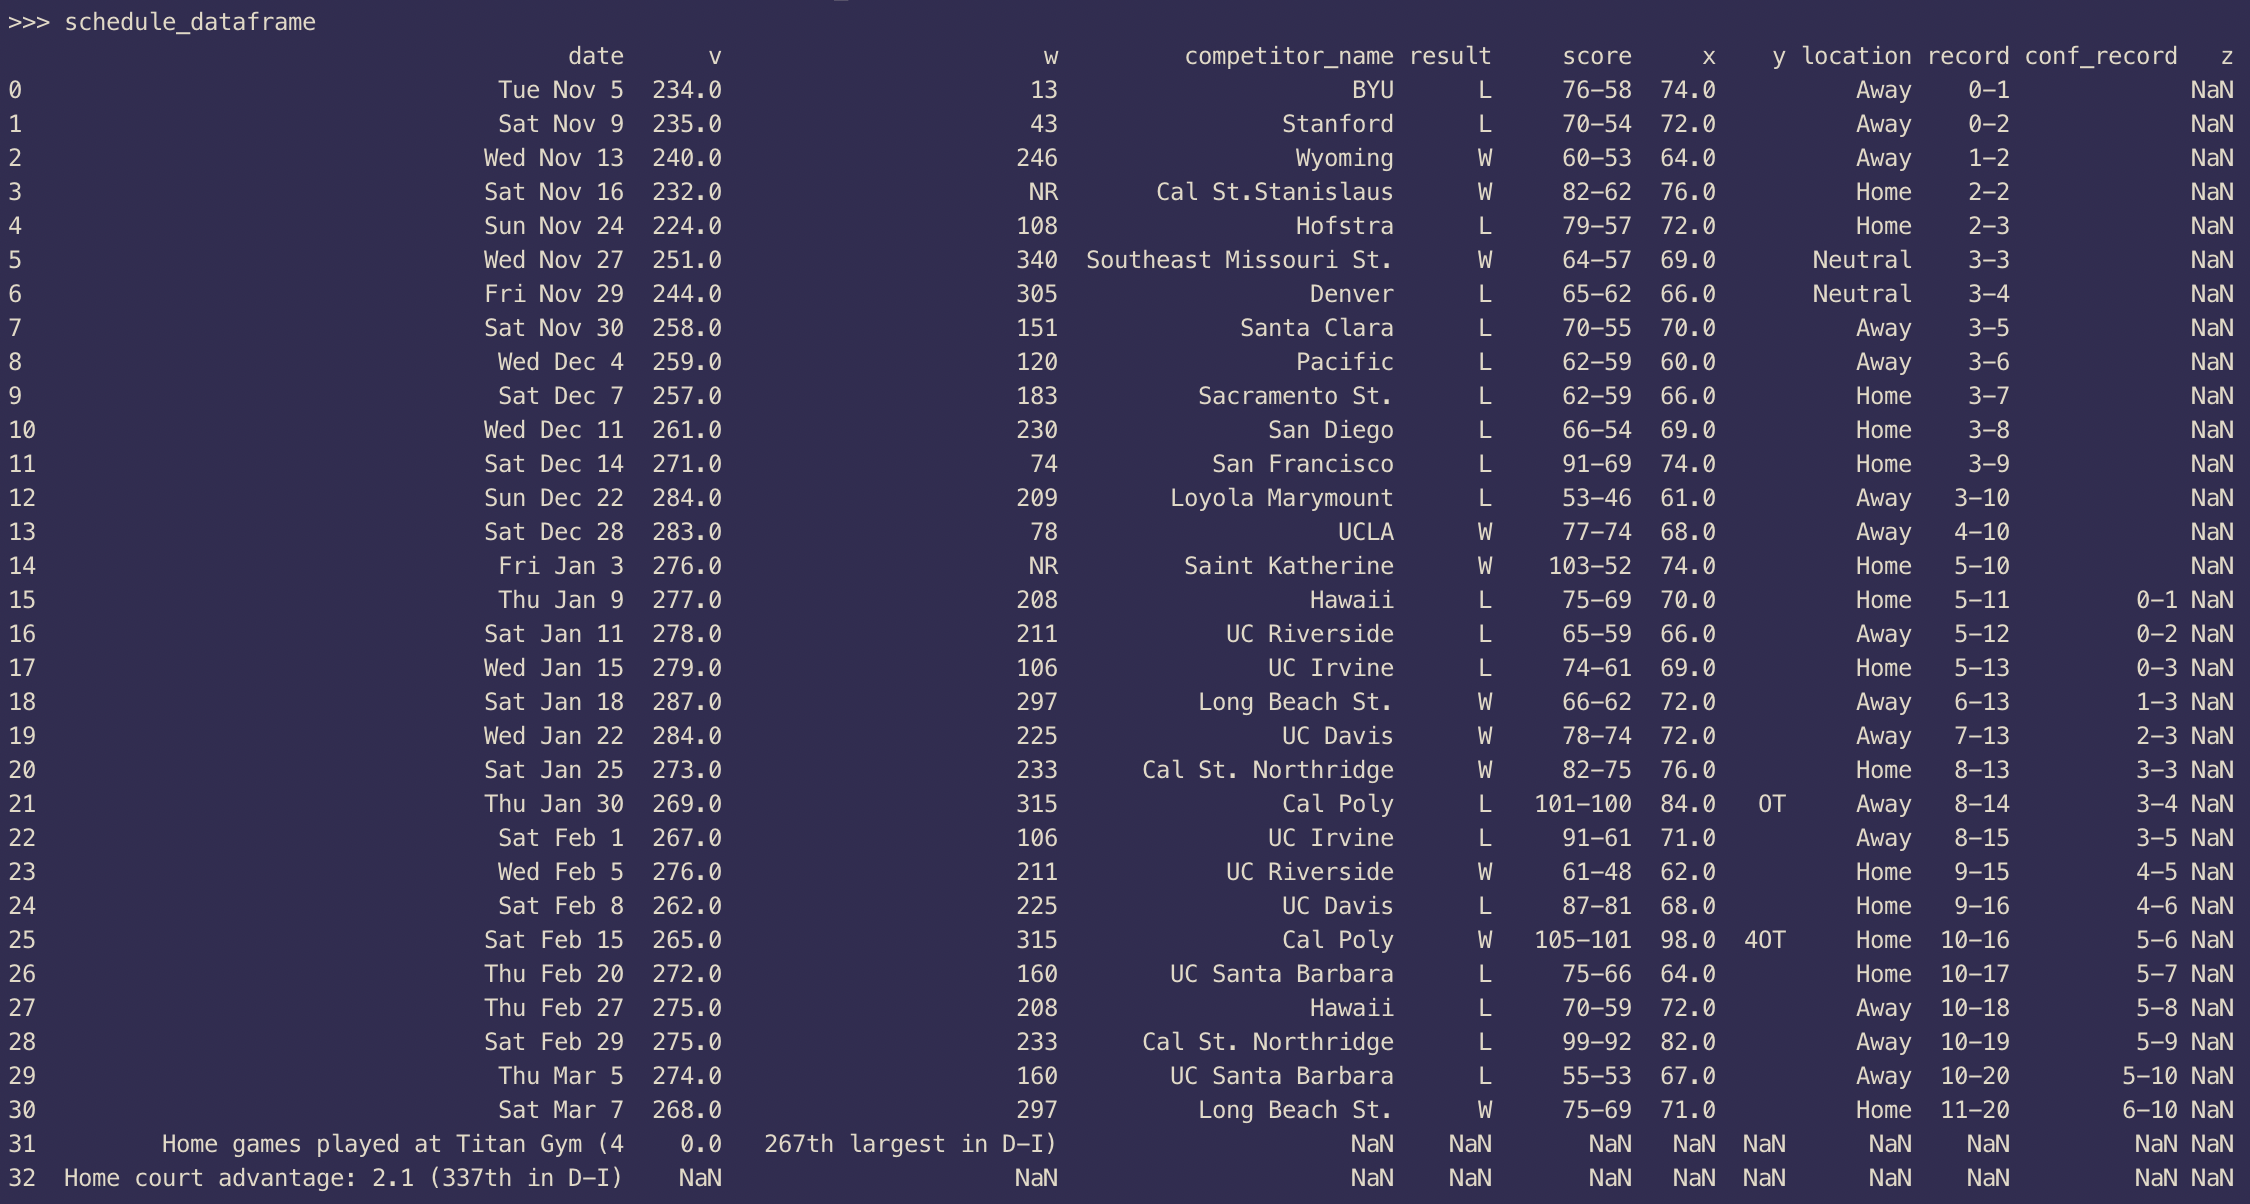
>>> print(schedule_dataframe)
                                   Tue Nov 5    234  ...    .1 Unnamed: 11
0                                  Sat Nov 9  235.0  ...               NaN
1                                 Wed Nov 13  240.0  ...               NaN
2                                 Sat Nov 16  232.0  ...               NaN
3                                 Sun Nov 24  224.0  ...               NaN
4                                 Wed Nov 27  251.0  ...               NaN
5                                 Fri Nov 29  244.0  ...               NaN
6                                 Sat Nov 30  258.0  ...               NaN
7                                  Wed Dec 4  259.0  ...               NaN
8                                  Sat Dec 7  257.0  ...               NaN
9                                 Wed Dec 11  261.0  ...               NaN
10                                Sat Dec 14  271.0  ...               NaN
11                                Sun Dec 22  284.0  ...               NaN
12                                Sat Dec 28  283.0  ...               NaN
13                                 Fri Jan 3  276.0  ...               NaN
14                                 Thu Jan 9  277.0  ...   0-1         NaN
15                                Sat Jan 11  278.0  ...   0-2         NaN
16                                Wed Jan 15  279.0  ...   0-3         NaN
17                                Sat Jan 18  287.0  ...   1-3         NaN
18                                Wed Jan 22  284.0  ...   2-3         NaN
19                                Sat Jan 25  273.0  ...   3-3         NaN
20                                Thu Jan 30  269.0  ...   3-4         NaN
21                                 Sat Feb 1  267.0  ...   3-5         NaN
22                                 Wed Feb 5  276.0  ...   4-5         NaN
23                                 Sat Feb 8  262.0  ...   4-6         NaN
24                                Sat Feb 15  265.0  ...   5-6         NaN
25                                Thu Feb 20  272.0  ...   5-7         NaN
26                                Thu Feb 27  275.0  ...   5-8         NaN
27                                Sat Feb 29  275.0  ...   5-9         NaN
28                                 Thu Mar 5  274.0  ...  5-10         NaN
29                                 Sat Mar 7  268.0  ...  6-10         NaN
30         Home games played at Titan Gym (4    0.0  ...   NaN         NaN
31  Home court advantage: 2.1 (337th in D-I)    NaN  ...   NaN         NaN

[32 rows x 12 columns]
There are a couple of important things to note here. Pandas doesn’t assign a header to this DataFrame. It tries to figure out the header automatically but it makes a judgment call that there is no header in the CSV. In such cases, we can supply a custom header.
Assigning Custom data header
We can assign custom column names (header) as part of the read_csv method. There are 12 columns in my CSV so I will provide a list of 12 names:
schedule_dataframe = pd.read_csv('input_file.csv',
                                names=['date', 'v', 'w', 'competitor_name',
                                        'result', 'score', 'x', 'y', 'location',
                                        'record', 'conf_record', 'z'])
The only thing you need to keep in mind is that the names need to be unique. I don’t care about the u, v, x, y, or z columns. I don’t know exactly what data they contain so that is why the names aren’t meaningful.
Now if we try to print this DataFrame we can see a header in the output:
Replacing data
For my project, I needed to remove those rows from the data whose w column contained “NR”. Pandas provides us a method to drop those rows whose certain columns contain NaN values. However, NR is not equal to NaN so first, we need to replace every occurrence of NR with NaN. We can easily do that by using the replace method of the DataFrame:
import numpy as np
schedule_dataframe['w'] = schedule_dataframe['w'].replace('NR', np.nan)
Now we can use the dropna method of the DataFrame to easily remove the rows whose w column contains NaN:
schedule_dataframe = schedule_dataframe.dropna(axis=0, subset=['w'])
The axis=0 tells Pandas to drop the row instead of the column. If we try printing the DataFrame now, the output will look something like this:
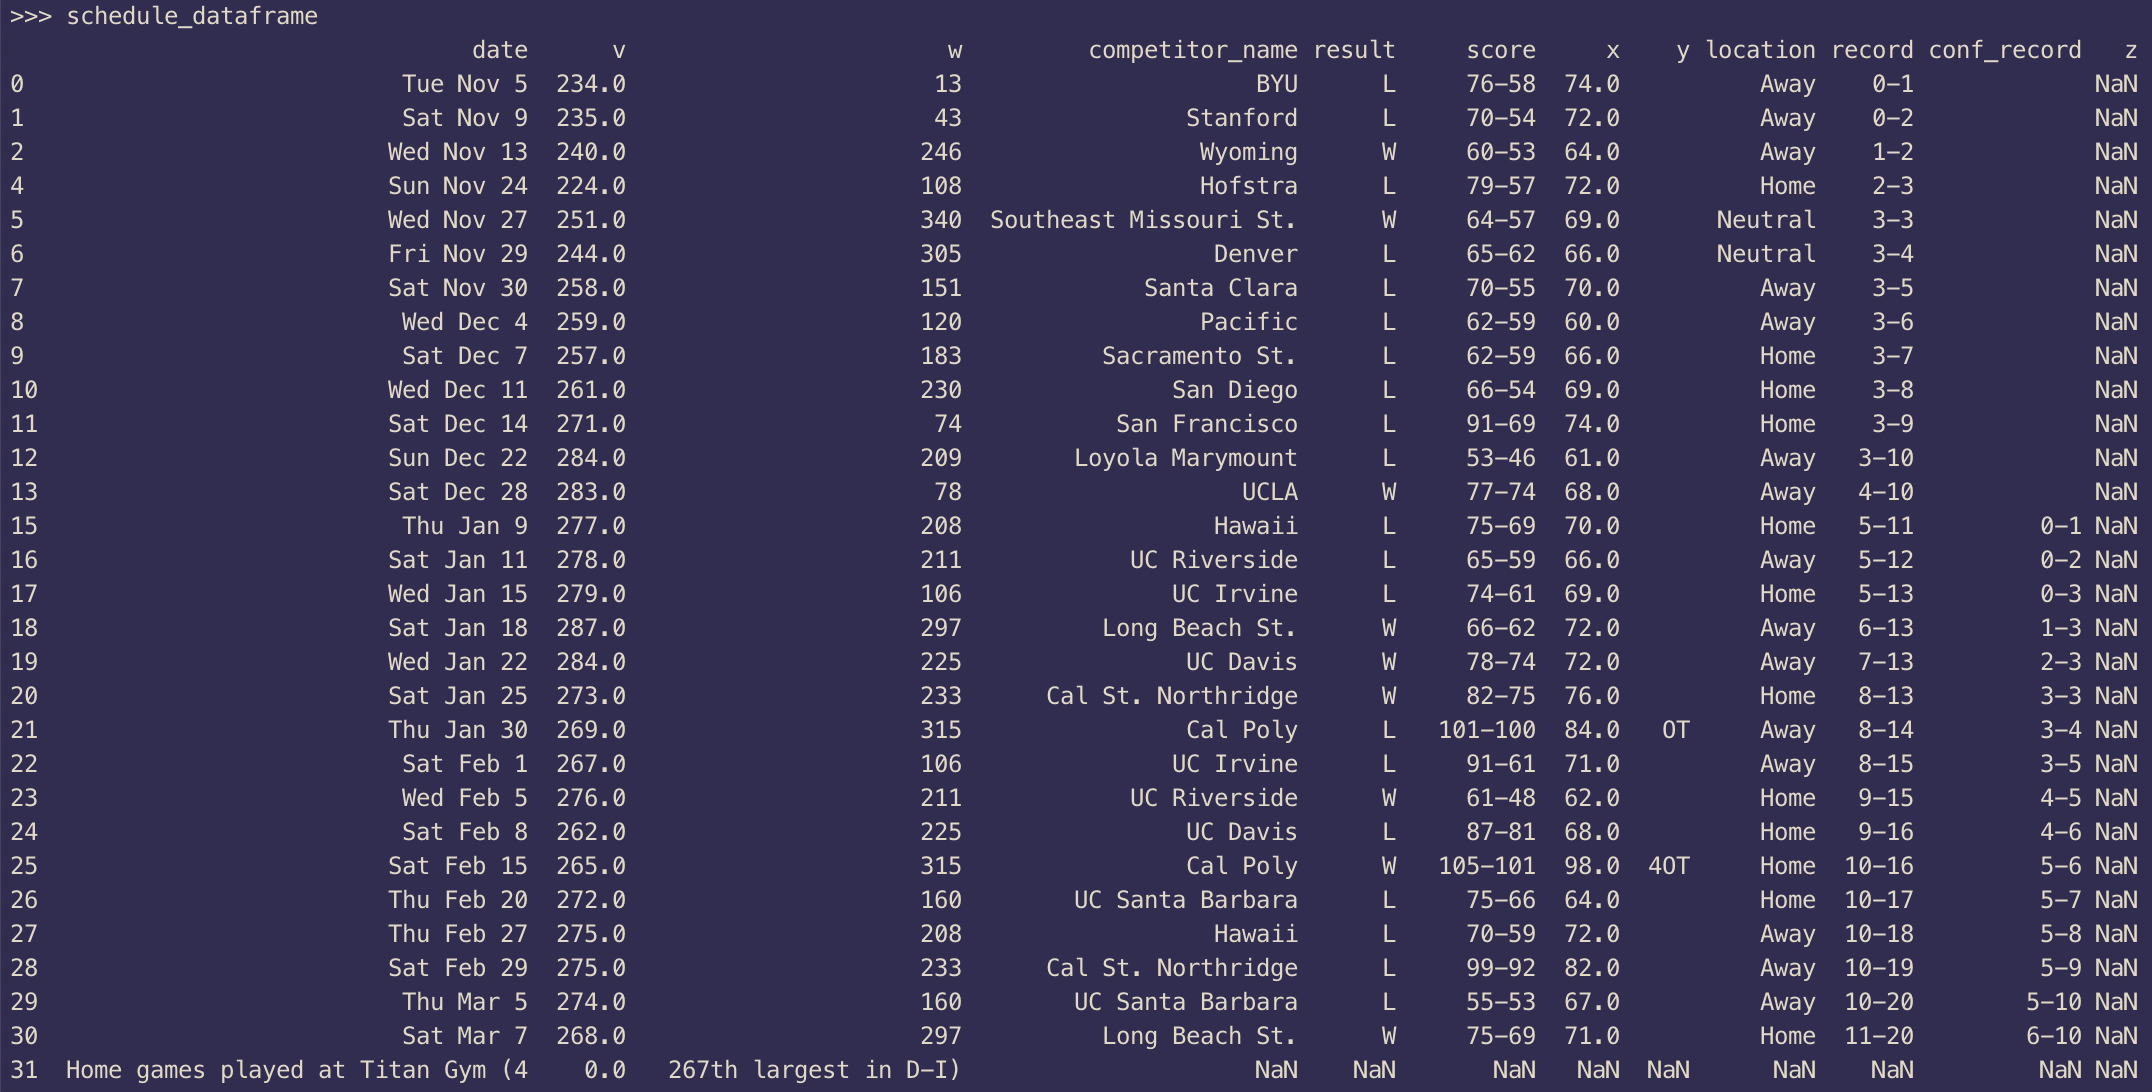
While removing the rows, Pandas does not update the index column. I don’t like that so while we are at it, let’s reset the index column as well so that we have a continuous range of index values:
schedule_dataframe = schedule_dataframe.reset_index(drop=True)
The output should now contain updated index values:
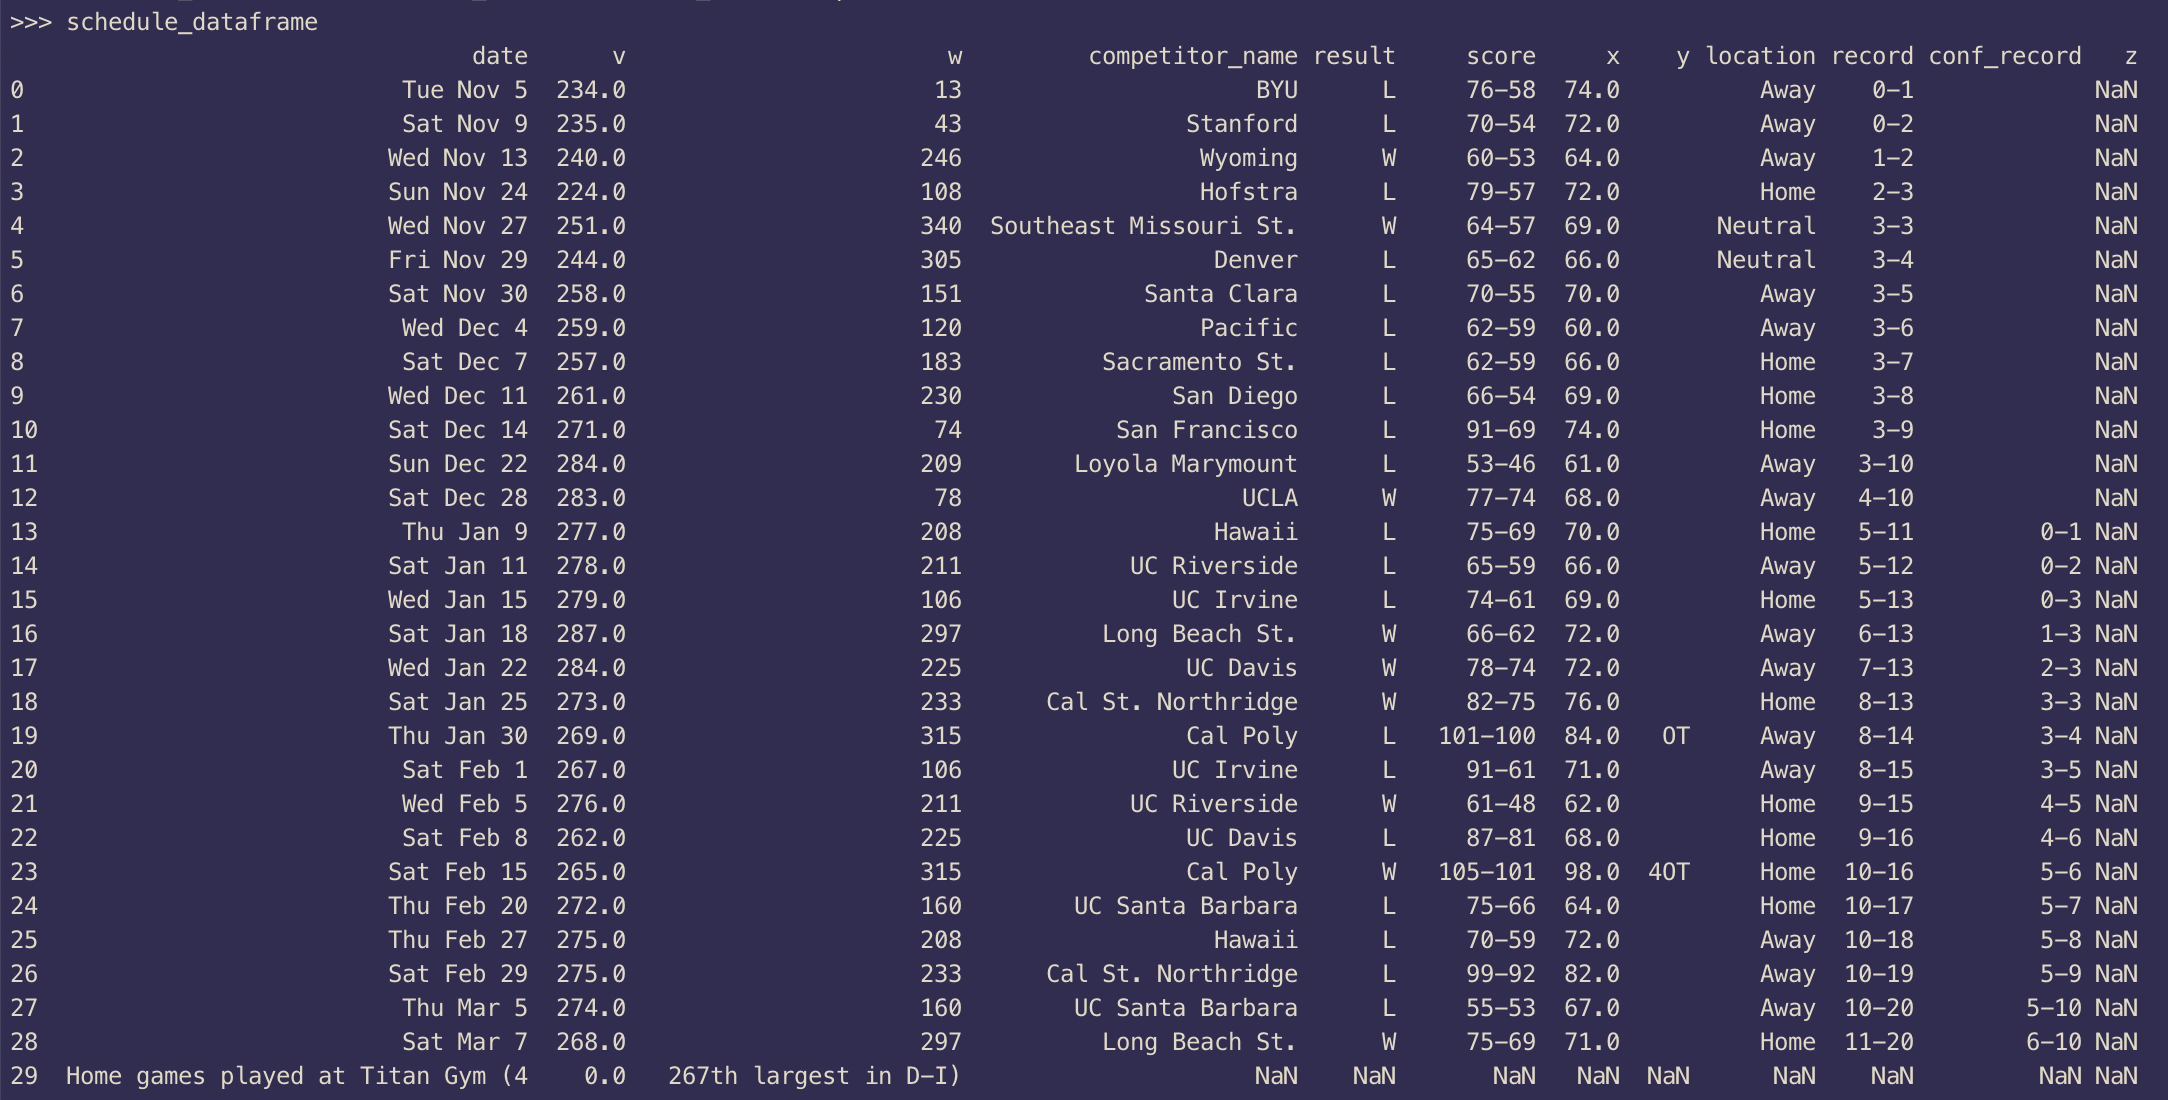
Removing a row from the DataFrame
I don’t want the z column in my DataFrame as it contains only NaN values so let’s drop that column from my DataFrame:
schedule_dataframe = schedule_dataframe.drop(['z'], axis=1)
Sweet! Now the output looks much cleaner:

During this step, I went ahead and removed the last row as well. I didn’t need it.
Converting column into a NumPy array
Now our w column only contains integer values. Let’s say I wanted to compare that whole sorted column with some other list. How can we do that? As it turns out, Pandas makes it incredibly easy for us to do exactly that. We just need to use the to_numpy method.
Here is how you do it:
scores = schedule_dataframe['w'].to_numpy()
scores

# array(['13', '43', '246', '108', '340', '305', '151', '120', '183', '230',
#       '74', '209', '78', '208', '211', '106', '297', '225', '233', '315',
#       '106', '211', '225', '315', '160', '208', '233', '160', '297'],
#      dtype=object)
Now you can sort them and do whatever you want with them.
Conclusion
This is where this short tutorial comes to an end. Pandas is really powerful and this tutorial doesn’t do it justice. Try it on any data processing or data analysis tasks and let me know how it goes. There is a reason it is an integral part of any data analysts' tool chest. I hope you learned something new today. I will see you in the next article. Stay safe and take care! 👋 ❤️
acromondx