Extracting Data from Nike Run Club & Visualizing It
Hi lovely people! 👋 Most people who know me in person know that I love running. I try to run at least twice a week. I properly started running in May 2017 and have been running more or less consistently since then. I have been using the Nike Run Club app to log all of my run data. When I started using it I had no idea that I was getting sucked into a walled garden and there was no official way to move my data out of the Nike ecosystem.
Now we know that the app loads data from the server so this means that there is definitely a remote API endpoint which we can access to get raw data. While I was trying to reverse engineer the NRC app to allow sniffing of SSL traffic, I came across a GitHub gist which contained NikePlus API description.
The author of that gist has put up a bash script which you can use to download all of your data from the Nike ecosystem and save it locally in json files.
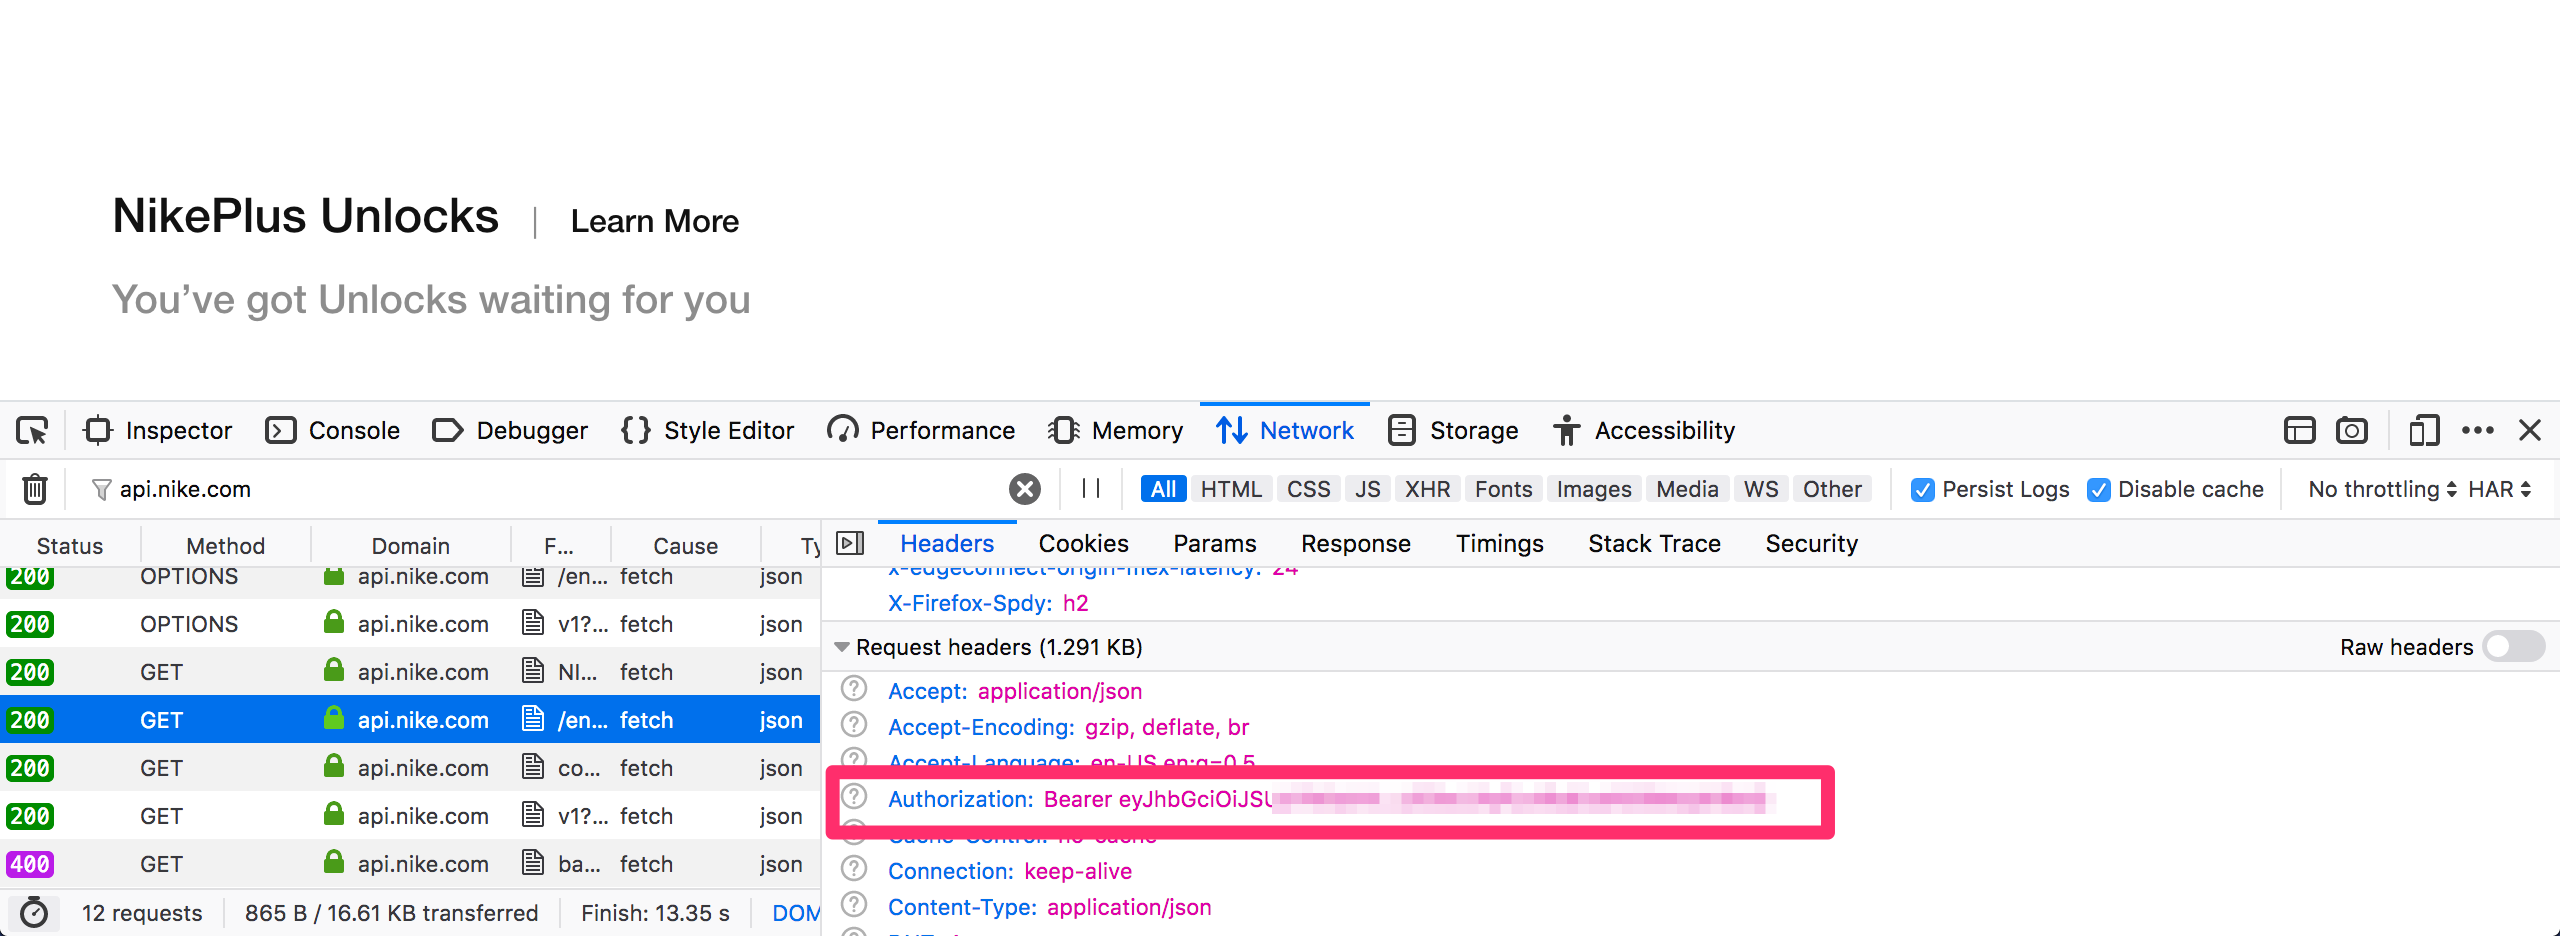
Now the tricky part is that the endpoint requires Authorization Bearer token which we don’t already know. As it turns out the online Nike website also uses the same authentication backend and uses the same Authorization token as the Nike app. So all we have to do is go to the NikePlus membership website and open the developer tools. With the developer tools open, log in to your same Nike account which you use with the mobile app.
Now search for a request to api.nike.com and scroll down to the request headers. You should be able to see the Authorization header.
Copy the Bearer token and pass that as an input to the bash script.
The steps to run the bash script are as follows:
- Download and save the script as
nike_activities.bashon Desktop - Open the terminal and type:
chmod u+x ~/Desktop/nike_activities.bash
- Run the script using the terminal (replace
<bearer_token>with your actual token):
~/Desktop/nike_activities.bash <bearer_token>
The bash script will download your data in activity-* files in the folder from where you run the script.
I used my data and some Jupyter Notebook and plot.ly magic to create this interactive graph. It contains my run data from since I began running.
I hope you guys liked the post. I will try to write up a small tutorial for the Python Tips blog where I will explain how I parsed the JSON files and made this small plot.
In the meantime, I hope you all have a wonderful day/night. I will see you in the next article! ❤️ 😊


Maria
Yasoob
In reply to Maria
JOe
In reply to Maria
zinee
Taylor
Yasoob
In reply to Taylor
Sean
Yasoob
In reply to Sean
David Weinstein
Yasoob
In reply to David Weinstein
JB
In reply to David Weinstein
Yasoob
In reply to David Weinstein