


Introduction to Machine Learning and its Usage in Remote Sensing
Hey guys! I recently wrote a review paper regarding the use of Machine Learning in Remote Sensing. I thought that some of you might find it interesting and insightful. It is not strictly a Python focused research paper but is interesting nonetheless.
Introduction to Machine Learning and its Usage in Remote Sensing
1. Introduction
Machines have allowed us to do complex computations in short amounts of time. This has given rise to an entirely different area of research which was not being explored: teaching machines to predict a likely outcome by looking at patterns. Machine Learning is being used to solve almost all kinds of problems ranging from Stock Market predictions to medical formulae synthesis.
There are multiple famous machine learning algorithms in use today and new algorithms are popping up every other day. Some of the widely known algorithms are:
- Support Vector Machines
- Neural Networks
- Random Forests
- K-Nearest Neighbors
- Decision Trees
- K-Means
- Principal Component Analysis
Different important steps are involved in getting the machines to predict dependable and reliable data.
2. Machine Learning in Remote Sensing
The roots of machine learning in remote sensing date back to the 1990s. It was initially introduced as a way to automate knowledge-base building for remote sensing. In their paper, Huang and Jensen (1997) talk about how a knowledge-base was built using minimal input from human experts and then decision trees were created to infer the rules from the human input for the expert system. The generated rules were used at a study site on the Savannah River. The conclusion details how the proposed machine-learning assisted expert system approach yielded the highest accuracy compared to conventional methods at that time. After such similar developments machine learning was soon adopted as an important tool by the remote sensing community. Now it is being used in all sorts of projects, from an unsupervised satellite image scene classification (Li, et al. 2016) to the classification of Australian native forests (Shang & Chisholm, 2014). Now we will take a look at the typical machine learning workflow.
3. Machine Learning Workflow
It is often important to acquaint yourself with the workflow involved. Machine Learning, too, has a workflow which is somewhat common to all of the machine learning based projects.
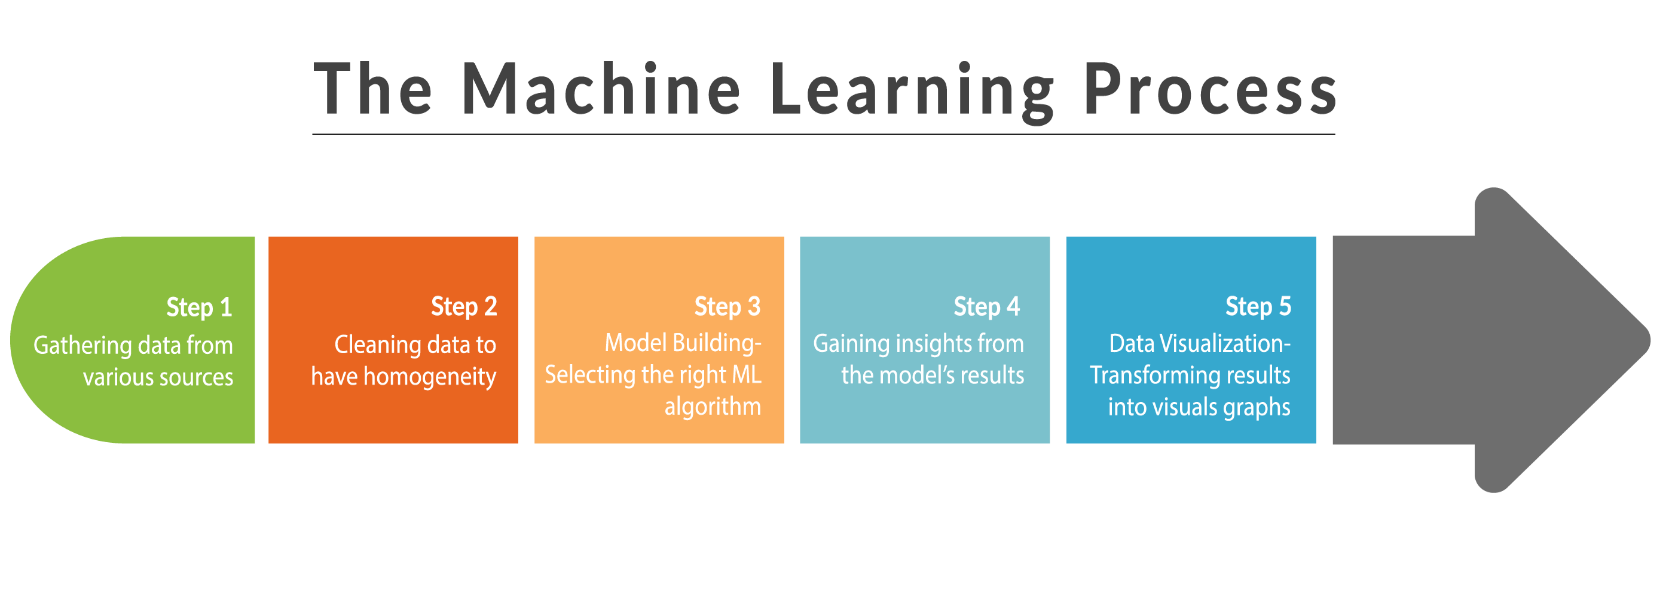
- Gathering Data
- Cleaning Data
- Model building & selecting the right algorithm
- Gaining Insights from the results
- Visualizing the data
In remote sensing one gathers data mostly using satellites or aerial drones. Data cleaning comes in when our dataset has incomplete or missing values and algorithm selection involves getting acquainted with the problem which one is trying to solve (more on this later). If one is making a model just for predictions and not specifically for gaining insights then the workflow ends here and one gets started with implementing the trained model in production. However, if one is writing a research paper or wants to gain insights then one can chart the results using a graphing library and draw insights from the charted data. We will counter the data cleaning and the model building part in this paper.
3.1 Data Cleanup
This process involves cleaning up textual and/or image-based data and making the data manageable (which sometimes might involve reducing the number of variables associated with a record).
3.1.1 Textual Data
Oftentimes, one might encounter missing values in one’s dataset. One has to decide whether to try and fill in the missing data by “guessing” the missing values using the neighbouring data or to drop that particular record altogether. Dropping records seems like a viable option but it might not be feasible if the dataset is already quite small. So one has to resort to filling in the incomplete data cells. There are multiple ways to do this but the easiest one is to take the neighbouring values and calculate an average.
3.1.2 Image Data
Data cleanup also involves manipulating images which might contain some artifacts that can interfere with one’s classification algorithms. Nath et al. (2010) in their paper about water-body area extraction tackle this exact problem. The images that they had contained building shadows which can very easily be confused with water-bodies. They partially solved this problem by calculating the entropy of the image and then used it to segment the image. Entropy refers to randomness. A Water-body has less randomness when compared with its surroundings so it is possible to extract the water-body area by segmenting the image based on the difference in the pixel colors. In other instances the image dataset might contain some blurry images which can gravely affect the accuracy of our algorithm in the training stage. One needs to get rid of such images in the data cleanup step.
3.1.3 Multiple Features
Oftentimes when one records data in the field of remote sensing, one is essentially recording multispectral or hyperspectral data (Shang, et al. 2014). This means that each record will have a lot of variables. If one tries to plot the dataset, one might not be able to make any sense of it because one will have a lot of pairwise correlations to think about if one plots a plethora of variables. To interpret the data more meaningfully, one needs some way to reduce the number of variables. This is where the Principal Component Analysis (PCA) comes in –it will reduce the number of variables to a few, interpretable linear combinations of the data. Each linear combination will correspond to a principal component. There are numerous tools available to help one with PCA. If one is utilizing the famous scikit-learn library, there is a PCA function which one can use.
3.2 Types of Machine Learning Algorithms
There are three broad classes of machine learning algorithms. One class is the supervised machine learning, the second is unsupervised machine learning, and the third is reinforced learning. The difference between supervised and unsupervised is that while using supervised algorithms, one has a dataset containing the output column whereas while using the unsupervised algorithms, one only has a huge dataset and it is the duty of the algorithm to cluster the dataset into various different classes based on the relation it has identified between different records. Reinforcement learning is slightly different. In reinforcement learning, one provides the algorithm with an environment and the algorithm takes decisions in that environment. It keeps on improving itself with each decision based on the feedback it gets for its last decision. We will now discuss three famous algorithms being used in remote sensing.
3.2.1 Random Forest
Random forest algorithms are increasing in popularity in the Remote Sensing community (Belgiu, et al. 2016) because of the accuracy of their classifications. These are ensemble classifiers, which basically means that they make use of multiple decision trees underneath. A major reason for the popularity of RF classifiers is that they help in alleviating the high dimensional problem. They provide a variable importance (VI) measurement which allows one to reduce the number of dimensions of hyperspectral data. Variable Importance is essentially the measure of how much change in a specific input affects the output.
3.2.2 Support Vector Machines
SVMs are supervised learning models which can be used for regression as well as classification problems. They are mostly used for classification problems. The way they work is by plotting the points (features) in a n-dimensional space (n features) and then coming up with a hyperplane which best divides those points. SVMs are being used in almost all types of classification problems in remote sensing, from forest categorization (Shang, X & Chisholm, 2014) to segmentation of multispectral remote sensing images (Mitra, et al. 2004). Just like other algorithms, their success depends on the nature of the problem and one will have to test each algorithm separately and then take a decision based on the performance of each algorithm.
3.2.3 Artificial Neural Networks
Neural Networks are a class of machine learning algorithms which try to mimic the way our brains work. The first application of neural networks (NN) in remote sensing was completed in 1988 (Kanellopoulos and Wilkinson 1997). Artificial Neural Networks are a type of Neural Networks. ANNs are the biologically inspired simulations performed on the computer to perform certain specific tasks like pattern recognition, clustering, classification etc. Their popularity has increased a lot recently due to technical advancements which became possible due to ANNs, an example is AlphaGo defeating the world champion of the game Go. This had never been done before, and it was considered a great feat. Accurate land cover classification used to be done mostly by statistical classifiers, but now ANNs have taken their place because ANNs provide an accurate way to classify land cover and geophysical features without having to rely on statistical assumptions or procedures. ANNs “learn” different patterns in images based on their own (by using artificial neurons) with a minimal set of inputs. They are also referred to as black-box algorithms because oftentimes it is hard to figure out how an ANN is figuring out the outputs.
4. Overfitting and Bias
Most of the times when you are developing a model for predicting/classifying images, you have a big dataset for training and testing your algorithm. We split the dataset into roughly a 75:25 ratio where 75% of the data is used for training and 25% is used for evaluating the performance of the model after it has been trained. 75:25 is not a hard ratio; you can use any other dataset division which strikes your fancy. The only problem you have to take care of is that the training segment of the dataset should have an unbiased representation of the whole dataset and that it should not be too small as compared to the testing segment of the dataset. Unbiased means that it should not have only one type of record from the dataset and should have almost every type of record which is a part of the dataset so that the model is trained over every different kind of input. If the training dataset is too small, then you might not get reliable predictions because the model has not been trained over every different type of input.
Overfitting is another problem which you need to take care of. Overfitting the model generally entails making an overly complex model to explain idiosyncrasies and outliers in the data under study. This means that if you use the same type of data (the type of data on which it has been trained) for evaluating the model, you will get a very high prediction/classification accuracy. However, if you modify the input just a little (something which the model has not seen before), then the prediction/classification accuracy takes a dip. You can fix overfitting by using a bigger dataset and segmenting the dataset properly. Additionally, it is beneficial to reduce the complexity of the model definition so that not all of the extreme edge cases are being classified.
5. Which algorithm is the best one?
The answer to this question depends on the problem which one is trying to solve. In some cases when you have multiple dimensions but limited records, SVM might work better. If you have a lot of records but less dimensions (features), Neural Networks (NN) might yield a better prediction/classification accuracy. One often has to test multiple algorithms on your dataset and choose the one which works the best. Oftentimes, it is necessary to tune various parameters for the different algorithms (i.e variable importance for RF, number of hidden layers and neurons for Neural Networks and “decision function shape” for SVMs etc.). A lot of times, a better accuracy may be achieved by combining multiple algorithms together; this is called ensemble. It is also possible to combine SVM and Neural Networks or SVM and RF (possibilities are endless) to improve the prediction accuracy. Again, one will have to test multiple ensembles in order to choose the best one.
It is also important to note that the prediction accuracy might change based on which particular feature one is trying to use for classification/prediction purposes. For instance, Shang and Chisholm (2014) discuss how when they had to classify Australian native forest species, they decided to use state-of-the-art remote sensing algorithms. They decided to classify trees at leaf, canopy, and community level. They tested various algorithms (SVM, AdaBoost and Random Forest) and found that each algorithm outperformed the other at each different level. At the leaf level, Random Forest achieved the best classification accuracy (94.7%), and Support Vector Machine outperformed the other algorithms at both the canopy (84.5%) and community levels (75.5%).
Another factor which can affect one’s algorithm choice is whether the data is linearly separable or not. For instance, linear classification algorithms (SVM, logistic regression etc.) expect that the data can be divided by a straight line in linear space. Assuming that the data is linearly separable might work for most cases but will be correct for some scenarios and will bring down the prediction/classification accuracy. Hence, we need to make sure that the algorithm used is able to handle the kind of available data.
It is not possible to look at an algorithm and decided theoretically whether it will yield the best results for your dataset or not because a lot of the machine-learning algorithms are black box algorithms. This means that it is hard to see how the algorithm is arriving at a specific result. Therefore, it is useful to first narrow down your algorithm choice based on the type of problem and then apply the narrowed down algorithms on a part of your dataset and see which one performs best.
6. Conclusion
In this paper we looked at what machine learning is, how it was first introduced into the world of remote sensing, what a typical workflow is like, and what kind of problems are being solved using machine learning. Machine learning has a bright future because more and more people are learning the basics of machine learning and applying it in their regular jobs and researches. New algorithms are cropping up every other day, and the accuracy rate of classifications are improving along with it. Those problems in remote sensing (mapping land cover) which seemed difficult and sometimes impossible are being solved by new algorithms every single day. It is not far-fetched to say that most analysis work done in the world today will be done by machine learning algorithms in near future.
Bibliography
- Belgiu, M., & Drăguţ, L. (2016). Random forest in remote sensing: A review of applications and future directions. ISPRS Journal of Photogrammetry and Remote Sensing, 114, 24-31, doi:10.1016/j.isprsjprs.2016.01.011
- Rodriguez-Galiano, V. F., & Chica-Rivas, M. (2014). Evaluation of different machine learning methods for land cover mapping of a Mediterranean area using multi-seasonal Landsat images and Digital Terrain Models. International Journal of Digital Earth, 7(6), 492-509, doi:10.1080/17538947.2012.748848
- Shang, X., & Chisholm, L. A. (2014). Classification of Australian native forest species using hyperspectral remote sensing and machine-learning classification algorithms. IEEE Journal of Selected Topics in Applied Earth Observations and Remote Sensing, 7(6), 2481-2489, doi:10.1109/JSTARS.2013.2282166
- Nath, R. K., & Deb, S. K. (2010). Water-body area extraction from high resolution satellite images-an introduction, review, and comparison. International Journal of Image Processing (IJIP), 3(6), 353-372,
- Li, Y., Tao, C., Tan, Y., Shang, K., & Tian, J. (2016). Unsupervised multilayer feature learning for satellite image scene classification. IEEE Geoscience and Remote Sensing Letters, 13(2), 157-161, doi:10.1109/LGRS.2015.2503142
- Huang, X., & Jensen, J. R. (1997). A machine-learning approach to automated knowledge-base building for remote sensing image analysis with GIS data. Photogrammetric engineering and remote sensing, 63(10), 1185-1193.
- Mitra, P., Shankar, B. U., & Pal, S. K. (2004). Segmentation of multispectral remote sensing images using active support vector machines. Pattern recognition letters, 25(9), 1067-1074, doi:10.1016/j.patrec.2004.03.004
- Melgani, F., & Bruzzone, L. (2004). Classification of hyperspectral remote sensing images with support vector machines. IEEE Transactions on geoscience and remote sensing, 42(8), 1778-1790, doi:10.1109/TGRS.2004.831865
- Kubat, M., Holte, R. C., & Matwin, S. (1998). Machine learning for the detection of oil spills in satellite radar images. Machine learning, 30(2-3), 195-215, doi:10.1023/A:1007452223027
- Maggiori, E., Tarabalka, Y., Charpiat, G., & Alliez, P. (2017). Convolutional neural networks for large-scale remote-sensing image classification. IEEE Transactions on Geoscience and Remote Sensing, 55(2), 645-657, doi:10.1109/TGRS.2016.2612821
- Pedregosa, F., Varoquaux, G., Gramfort, A. & Michel, V. (2011). Scikit-learn: Machine Learning in Python. Journal of Machine Learning Research, 12, 2825-2830.
- Jensen, R. R., Hardin, P. J. and Yu, G. (2009), Artificial Neural Networks and Remote Sensing. Geography Compass, 3: 630–646. doi:10.1111/j.1749-8198.2008.00215.x
I hope you guys enjoyed the paper. I am open to any kind of comments and suggestions. Till next time!
Manhar
Idrees