


Debugging ETW Event Drops in High-Throughput Applications
I was working on a production application recently where we rely heavily on ETW (Event Tracing for Windows) to emit high-frequency events. We are talking about millions of events every few seconds. We started noticing gaps in our telemetry—we were running into event drops.
This was a critical issue. If you are losing events, you are flying blind. I had to figure out which provider was producing the most events and where the bottleneck was. The challenge was that we already had an existing telemetry agent listening to these events, and I didn’t want to disrupt its operation.
How do you debug a system that is already struggling under load without making it worse? It was hard to find a straightforward guide on “spying” on existing sessions without breaking them. Most of my research led me to generic documentation, so I decided to document the method I used to isolate the noisy provider and measure the drops.
There were a few things I needed to figure out:
- How to identify the existing session and providers
- How to run a parallel “spy” session
- How to analyze the dropped event data
Let’s go through them one by one.
What is ETW anyway?
Before we fix it, let’s briefly touch on what ETW is for the uninitiated. If you have a few minutes, this video does a very good job of explaining what ETW is and how it works:
Here is a diagram from Microsoft’s blog that highlights the main components of ETW:
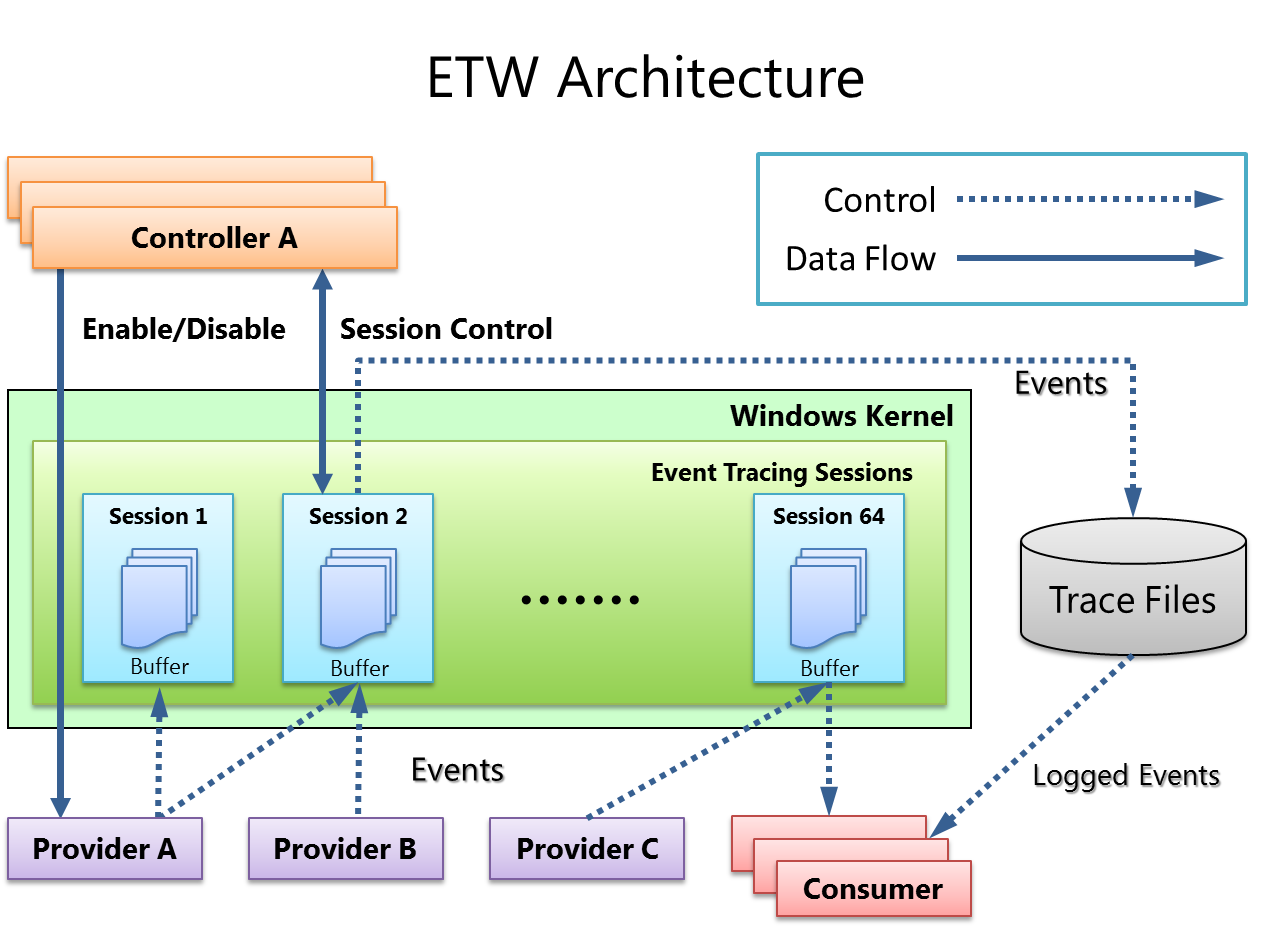
As illustrated in the diagram above, ETW relies on a few distinct components working in unison:
- Controllers (Top Left): These are tools like
logmanor thewprcommand. They tell the system, “Hey, create Session 1 and start listening.” - Providers (Bottom Left): This is your application code. It fires events into the void (“Something happened!"), usually without knowing who is listening.
- The Kernel Session (Green Box): This is the critical piece for debugging drops. When a session is active, the Kernel allocates Buffers (the blue file icons) in non-paged memory. This is where events sit before they are written to a file or read by a consumer.
- Consumers (Bottom Right): These are your monitoring agents. They request data from the buffers.
The problem of “Event Drops” is essentially a traffic jam in the green box. As shown in the diagram, data flows from Provider → Buffer → Consumer. If your Provider fills those blue Buffers faster than the Consumer can empty them, the Kernel has no choice but to discard the newest events.
It is designed to be incredibly fast, but physics still applies: if you pour water into a funnel faster than it drains, it spills.
1. How to identify the existing session and providers
The first step was figuring out exactly what the existing monitoring agent was doing. I couldn’t just guess the Provider IDs. Windows has a built-in command-line tool called logman that is perfect for this.
I ran the following command to list all currently running event tracing sessions:
logman query -ets
This produces an output similar to this:
Data Collector Set                      Type                          Status
-------------------------------------------------------------------------------
EventLog-Application                    Trace                         Running
EventLog-System                         Trace                         Running
NtfsLog                                 Trace                         Running
Circular Kernel Context Logger          Trace                         Running
MyDebugSession                          Trace                         Running
This gave me a list of active sessions. I found the session corresponding to our telemetry agent (MyDebugSession in the example above). By querying that specific session, I could see exactly which Providers (by GUID or name) it was listening to.
Run the following command to find all the provider GUIDs a session is listening to:
logman query "MyDebugSession" -ets
This command will produce a verbose output, but look for the Provider: sections:
Name:                 MyDebugSession
Status:               Running
...

Provider:
Name:                 {1AACEA33-2593-5BEE-5746-BCEDB745CD07}
Provider Guid:        {1AACEA33-2593-5BEE-5746-BCEDB745CD07}
...

Provider:
Name:                 {6A03660A-10F6-51E1-DAB5-343DA7A7680F}
Provider Guid:        {6A03660A-10F6-51E1-DAB5-343DA7A7680F}
...
Next, I grabbed all the provider GUIDs and put them in a providers.txt file:
{1AACEA33-2593-5BEE-5746-BCEDB745CD07}
{6A03660A-10F6-51E1-DAB5-343DA7A7680F}
{B39F4EF0-34CB-5F8E-578D-183AAEA6CB31}
2. How to run a parallel spy session
Here is the tricky part. I couldn’t stop the existing agent to run my tests. I needed to run a parallel spy session.
ETW allows multiple sessions to subscribe to the same provider. This means I could spin up a new session, subscribe to the same providers found in Step 1, and record the data to a file for analysis, all while the production agent kept running.
I used logman again to create this spy session:
logman create trace "SpySession" -pf "providers.txt" -o "C:\temp\spy_events.etl" -ets
I let this run for a few seconds—just enough to capture the high-throughput burst—and then stopped it using this command:
logman stop "SpySession" -ets
The resulting spy_events.etl file turned out to be around 2GB while capturing events for only a few seconds. That was my first clue that the volume was massive.
3. How to analyze the dropped event data
Once I had the .etl file (the standard format for ETW logs), I ran an analysis on it. You can use tools like Windows Performance Analyzer (WPA) or tracerpt to parse these files. I ended up using tracerpt as it is available by default whereas WPA requires a separate install.
You can run an analysis using this command:
tracerpt spy_events.etl -y -summary summary.txt
The analysis provided exactly what I was looking for: a breakdown of event counts and, crucially, the “Total Events Lost” counter.
Here is what the data looked like (truncated):
Files Processed:
    spy_events.etl
Total Buffers Processed 248423
Total Events  Processed 6110264
Total Events  Lost      5580908
Start Time              Tuesday, December 23, 2025
...
+---------------------------------------------------------------------------------------------------------+
|Event Count   Event Name           Event ID        Version         Guid                                  |
+---------------------------------------------------------------------------------------------------------+
|          2   EventTrace           0               2               {68fdd900-4a3e-11d1-84f4-0000f80464e3}|
|     143003                        1               5               {c4859ff3-8549-54e3-adc3-dfcb805b4146}|
|      63916                        6               2               {c4859ff3-8549-54e3-adc3-dfcb805b4146}|
|    1040793                        9               2               {c4859ff3-8549-54e3-adc3-dfcb805b4146}|
|    1308511                        11              2               {c4859ff3-8549-54e3-adc3-dfcb805b4146}|
| ...
+---------------------------------------------------------------------------------------------------------+
It was immediately obvious. Event ID 9 and 11 were spamming the system with over a million events each in that short window. The kernel buffers simply couldn’t keep up, resulting in over 5 million “Total Events Lost.”
These Event IDs are specified in the code while creating a new ETW event, so a simple GREP took me straight to the source. The fix was clear: I had to either throttle the events, batch multiple events into one, or reduce the collection verbosity level in our monitoring agent so that we don’t listen to all events in production.
Conclusion
I had fun digging into the lower levels of Windows tracing and figuring out that you can essentially “wiretap” your own applications without bringing them down. Debugging high-frequency systems can feel like trying to fix a jet engine while flying, but with tools like logman and the ability to run parallel ETW sessions, you can peek under the hood safely.
I am pretty sure there are more advanced ways to do this with WPA (Windows Performance Analyzer), but for a quick diagnosis on a production machine where you can’t install new tools, logman and tracerpt are perfect solutions.
If you are dealing with mysterious data gaps in Windows, I highly recommend getting comfortable with logman. It might save you days of guessing.
I hope this article helps those who are trying to debug similar high-throughput issues! 😄
✍️ Comments
Thank you!
Your comment has been submitted and will be published once it has been approved. 😊
OK